Retail replenishment strategies: four options compared
The promotion started on a Monday. Store 14, a mid-sized shop on a high street, had agreed two months earlier to put a 2.40 EUR margin product on the end cap at a discount for two weeks. Marketing had the flyer out. The store manager had the shelf talker up. And the ERP, which had been replenishing that product on a min of 50 and a max of 70 since 2023, had 16 units on hand and nothing on the way.
By Wednesday the shelf was empty. By the following Monday the delivery that the min-max rule finally triggered arrived, 36 units, and sold through in three days. Nobody got blamed, because the system had done exactly what it was set up to do. That is the problem with retail replenishment strategies: the wrong one doesn't fail loudly. It just leaves money on the table every time demand does something an average can't see.
I've told this story in different stores with different products more times than I'd like. So this post uses store 14's six weeks to compare the four replenishment strategies a store can run on: min-max, reorder point, periodic review and forecast-driven. Same product, same promotion, four outcomes, and a short list of things to ask your ERP admin about afterwards.
What went wrong, strategy by strategy
All four strategies answer the same two questions, when to order and how much. Every ERP I've seen can run at least two of them. The difference is what each one knows about next week, and here is how each would've handled store 14.
Min-max
Order up to the max whenever stock drops under the min. Two numbers per product and store, set once, and in store 14's case set during a year with no promotions. The rule can't see the end cap coming because nothing in it looks forward; it looks at the shelf and the two numbers.
Verdict Right for the slow, steady, cheap half of a range. The most common wrong answer for everything else.
Reorder point
Order a fixed quantity, often a pallet or an economic order quantity, whenever stock drops under the reorder point. In store 14 it would've done better than min-max, but only by accident: its fixed lot of 48 is big, so it carried more stock into the promotion. It would've carried another 48 out the far side, into the lull.
Verdict Fine for steady products bought in lots. Its "wins" on promotions are the kind that cost you in excess the month after.
Periodic review
Every review, say each Monday, top up to an order-up-to level. It's min-max with the check on a calendar instead of a trigger, and if your supplier only delivers on Thursdays you're running this whether you call it that or not. In store 14 it would've ordered small amounts every week, which looks disciplined right up to the week it mattered.
Verdict The natural fit when delivery days are fixed. Still blind to anything the average doesn't show.
Forecast-driven
Order what this product's own forecast needs over the lead time and review period, plus safety stock, minus what's on hand and already coming. The only one of the four where next week is allowed to be different from last week. Marketing agreed the end cap two months ahead, so a store-level forecast would've had the 50 a week in it from the start.
Verdict The right strategy for anything that moves and anything that matters. More work than it's worth for a product that sells one a week all year.
Two of these are the same animal in different coats. Min-max checked weekly with a max set to lead time plus review demand is periodic review with extra steps, and a reorder point with a fixed lot is min-max where the max floats. People argue about which is "correct". For a product selling the same 20 a week all year they land within a case of each other. The argument only matters when demand moves. Which, in retail, is most of the time.
Six weeks, side by side
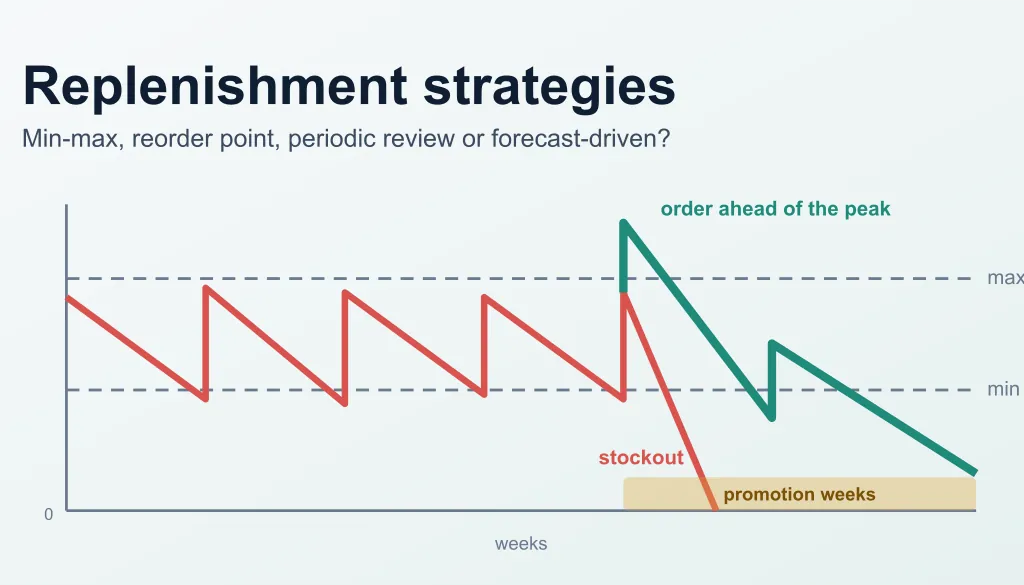
The chart shows the two extremes. Reorder point and periodic review sit between them, and the table below runs all four so you can check the arithmetic yourself. I'd encourage it. Every replenishment argument I've won was won on a six-row table like this one.
The worked example, all four strategies
The inputs, so the table recomputes:
From those: lead time demand is 20 × 2 = 40, the reorder point is 40 + 10 = 50, and the max and the order-up-to level are both 20 × 3 + 10 = 70. The reorder point strategy orders a fixed 48, four cases. The forecast-driven rule orders forecast over three weeks plus 10 safety stock, minus on hand and on order, rounded up to cases. Six weeks of actual demand add up to 20 × 4 + 50 × 2 = 180 units.
Each cell reads: stock at the end of the week after sales, then the order placed at that review. Position means on hand plus on order. A delivery shows as a plus at the start of the row.
| Wk | Reorder point | Min-max | Periodic review | Forecast-driven |
|---|---|---|---|---|
| 1 | 40; position under 50, order 48 | 40; order 30 → 36 | 40; order 30 → 36 | 40; needs 20 + 20 + 20 + 10 − 40 = 30 → 36 |
| 2 | 20; position 68, nothing | 20; position 56, nothing | 20; position 56, order 14 → 24 | 20; needs 20 + 20 + 50 + 10 − 56 = 44 → 48 |
| 3 | 0; position 48, order 48 | 0; position 36, order 34 → 36 | 0; position 60, order 10 → 12 | 0; needs 20 + 50 + 50 + 10 − 84 = 46 → 48 |
| 4 | +48, 28; position 76, nothing | +36, 16; position 52, nothing | +36, 16; position 52, order 18 → 24 | +36, 16; needs 50 + 50 + 20 + 10 − 112 = 18 → 24 |
| 5 | 28 − 50: 22 lost; order 48 | 16 − 50: 34 lost; order 36 | +24, 40 − 50: 10 lost; order 36 | +48, 64 − 50 = 14; needs 14 → 24 |
| 6 | +48, 48 − 50: 2 lost | +36, 36 − 50: 14 lost | +12, 12 − 50: 38 lost | +48, 62 − 50 = 12 on hand |
That's not luck. The forecast-driven rule ordered against the demand that was going to happen, and the other three ordered against the demand that used to happen. On one product in one store this is 115 EUR. Store 14 runs about two thousand products with three promotions a year each. Do that multiplication yourself, then go and look at your promotion calendar.
Run the same six weeks without the promotion, 20 a week throughout, and every strategy keeps the shelf stocked. The forecast-driven rule earned nothing there and cost a forecast to maintain. For a C item that sells one a week all year with a case pack of 12, min-max with a min of one case is right and anything cleverer is vanity. Forecast-driven goes where demand moves and margin is at stake, not everywhere.
In practice that sorts a typical range into roughly a third forecast-driven, a third reorder point or periodic review, and a third min-max; our page on ABC-XYZ analysis describes the segmentation that split hangs on.
The parameters nobody has touched since 2023
A strategy is a shape. Parameters make it fit, and in store 14 the shape wasn't the only thing wrong. The min of 50 was set once and never revisited, the safety stock was a round 10, and nobody had checked whether the review period was in the protect period at all. Whatever strategy a product runs on, these five lines are the checklist I'd put against it:
- Safety stock scales with demand. One week of forecast for A items, one and a half for B, two weeks or one case for C. Never a round number.
- Protect period is lead time plus review period. A reorder point that covers only the lead time is a week too low.
- Case pack and minimum order are rounded in the rule, not at the dock. From the supplier's current price list, not the one from 2023.
- Maximum cover is capped in weeks per class. 8 for A and B, 12 for C, and the cap wins over the formula.
- Forecast bias is tracked over a rolling four weeks. Beyond ±15 percent the product goes back to reorder point until the forecast earns its place.
The last line is the one people skip. A forecast-driven rule running on a forecast nobody checks will order the wrong number with complete confidence. Our explainer on how demand forecasting works covers what a usable store-level forecast needs, and it's less than most people fear and more than a four-week average.
Three questions to ask your ERP admin on Monday
- "Which products are on which strategy, and when were the parameters last changed?" If the answer is "everything's on min-max" and the date is a year or more ago, you've found the first thing to fix, and it isn't the software. Ask for the list per store, not per product. The flagship and the kiosk don't sell at the same rate, and a min that's a week of cover in one is a day in the other.
- "Does the reorder point include the review period, and is the max capped?" Two yes-or-no questions that catch most of the silent damage. The same gap breaks the transfer rule we wrote about last week, for the same reason: it protects the gap you can see instead of the gap you have to cover.
- "Where does next month's promotion calendar go, and who puts it there?" If the answer is "nowhere, the planner adjusts by hand", then every promotion is store 14 waiting to happen. The right answer is a store-level forecast that marketing's calendar feeds, and the planner reviewing exceptions on top of it. Judge the result on fill rate and weeks of cover together, as in Inventory KPIs for Retail, because low stock on its own is not the goal; it's a side effect of the right stock.
Where Catwing fits
Every strategy above is only as good as the forecast under it, and the forecast-driven one doesn't exist without a per-product, per-store forecast refreshed as sales come in. That is what Catwing builds from your ERP data. It sets healthy stock levels for every product in every store and proposes the purchase orders and transfers that keep you there, with the reasoning next to each line. Planners approve, adjust or reject, and the reasons feed back. If you want to know which third of your range would move to forecast-driven replenishment and what that's worth, bring a product list and we'll run store 14's six weeks on your numbers.
Frequently asked questions
What are the main replenishment strategies in retail?
Four cover nearly everything: min-max, reorder point with a fixed order quantity, periodic review with an order-up-to level, and forecast-driven replenishment that orders what a product's own forecast needs over the lead time and review period. The first three use an average demand; the fourth uses a forecast that changes week to week.
How do you calculate a reorder point?
Reorder point = forecast per week × lead time in weeks + safety stock, and if you only review stock once a week, add the review period to the lead time. For a product selling 20 a week with a two-week lead time and 10 units of safety stock, that is 20 × 2 + 10 = 50.
Which replenishment strategy works for seasonal or promoted products?
Forecast-driven, and only that one. Min-max, reorder point and periodic review all order against an average of recent weeks, so they're late into every peak and heavy coming out of it. In the example above the fixed rules lost between 24 and 48 of 100 promotional units; the forecast-driven rule lost none.
How often should replenishment parameters be reviewed?
Quarterly for the whole range, immediately for any product that changed ABC or XYZ class, and after any supplier change to lead time or case pack. A parameter nobody has looked at for a year is a decision nobody is making.